Orange, CA – The A. Gary Anderson Center for Economic Research at Chapman University released today the results of its 37
th
annual economic forecast for the U.S., California and Orange County. The forecast was presented to about 1,500 Orange County business leaders at a conference held at the Segerstrom Center for the Arts, Costa Mesa. Following are highlights of the forecasts.
2015 U.S. Forecast
- Now 64 months old, the current recovery is slightly longer than the average duration of past recoveries, but its accumulated growth of 12.5 percent pales in comparison to recoveries that led to total growth of 40 percent before encountering recessionary forces. This suggests that the current recovery has legs.
- While unemployment at around six percent is down from recessionary levels, it’s still relatively high. In addition, the labor force participation rate is declining and at a current level of 62.8 percent is way off its pre-recession high of 66.1 percent. So it appears labor markets have enough slack to fuel continued growth.
- The greatest concern about the durability of the recovery is a widely anticipated sharp drop in global demand for U.S.-produced goods and services. A recent surge in the trade-weighted value of the U.S. dollar will tend to reduce demand for U.S. goods and services. But when our model accounts for all the relevant global factors, we see U.S. export growth increasing in 2015, albeit at a slightly slower rate than is currently estimated for this year.
- Unlike 2013, when the economy had to withstand a decline in federal spending, we project that federal government purchases will increase for the first time since most of the Recovery Act’s spending winded down.
- Investment spending will also serve as an engine of growth next year. Nonresidential investment will be fueled by strong loan demand. In addition, corporate America is taking advantage of low interest rates in issuing large bond offerings for investment purposes. With capacity utilization nearing 80 percent, there will be increased demand for investing in plant and equipment. Our forecast calls for nonresidential investment to increase from an already healthy rate of 5.6 percent in 2014 to an even stronger 6.1 percent in 2015.
- Investment spending in residential structures will also pick up steam. Our forecast calls for housing starts to finally crack the one million figure in 2015, a level not seen since 2007.
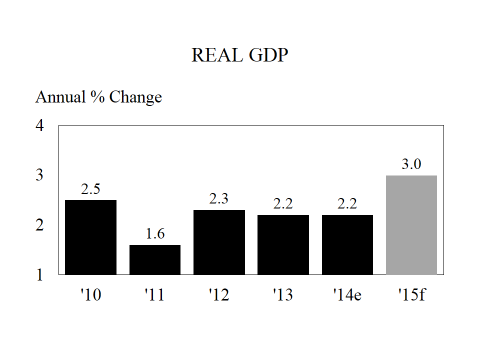
- The strong wealth effect occasioned by high net worth as well as relatively low household debt will fuel stronger consumer spending. This, in turn, is projected to lead to real GDP hitting an average annual growth rate of three percent in 2015—the first time that will happen since the recovery began.
- Faster aggregate spending growth will place some pressure on prices, but not much. The price index preferred by the Fed in gauging inflationary pressure is forecasted to hit two percent. Such a pickup in inflation is not expected to spook the Fed, especially since two percent is the minimum target rate set by the Fed.
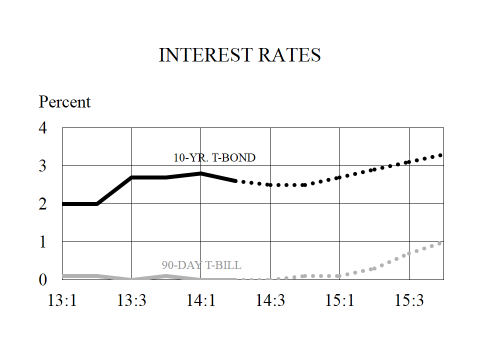
- Moderate price pressure will keep the Fed mostly on the sidelines in 2015. As a result, it’s extremely unlikely that the Fed will act aggressively in pushing up interest rates. It is likely, however, that the Fed will allow demand pressure to exert some upward pressure on both long-and short-term rates.
2015 California and Orange County Forecasts:
- Current monthly employment statistics issued by the Employment Development Department (EDD) suggest that the pace of job growth has slowed significantly in California and Orange County. We believe the current monthly job growth both in California and Orange County is underestimated. The EDD’s sampling methodology does not fully capture job creation by newly established small firms and hiring by existing small firms that add only one or two workers.
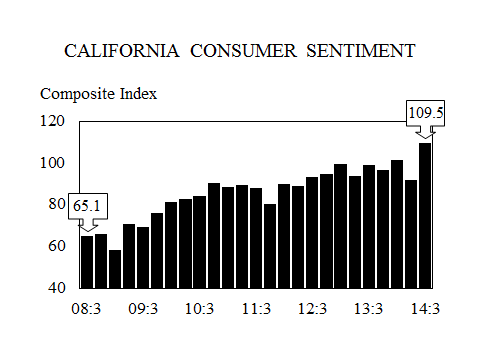
- Steady job creation, lower unemployment rates along with higher equity and home values have brightened consumer sentiment in California. Our survey of California consumer sentiment hit its highest reading since the beginning of the recession in the fourth quarter of 2007.
- Optimistic consumers have increased spending and that in turn positively affected employment in the retail, wholesale, food and leisure sectors. This trend should continue into 2015.
- Our measure of construction spending which is derived from six-quarter lagged values of total building permit valuation increased sharply over the 2012-2014 period. With home prices increasing in an environment of tight supplies, the residential construction industry responding by increasing the number of new housing permits. The permits drawn in 2014 will become actual spending in 2015.
- On the nonresidential front, high vacancy rates, soft lease rates and property values well below replacement costs ruled out many economically viable commercial projects over the past five years. But vacancy rates are dropping and lease rates are firming. This trend suggests that some new construction projects, particularly on the industrial side where vacancy rates are particularly low, will come on line in 2015.
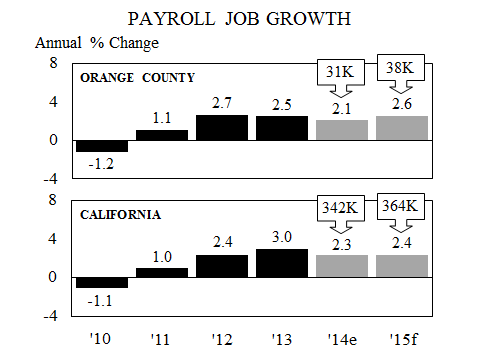
- The positive trends in construction spending, real GDP, and consumer spending bodes well for overall job creation in California and Orange County.
On an annual basis, California is forecasted to gain 364,000 payroll jobs. Orange County total payroll employment is projected to increase by 2.6 percent or a gain of 38,000 jobs.
- Rapid increases in home prices and anemic income growth over 2013-2014 period more than offset low mortgage rates. As a result, home purchase became less affordable during this period. A home buyer with an estimated median family income of $86,600 in 2014 needed to allocate about 35.0 percent of gross income to pay for interest, principal and property taxes. While this is significantly lower than the 47.3 percent of gross income needed in 2006, it is higher than the 27.2 percent needed in 2012.
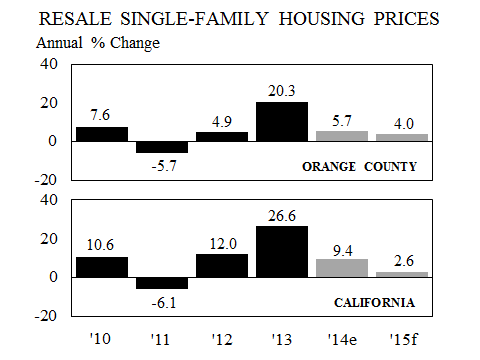
- While job growth will induce higher levels of household formation, relatively low housing affordability will dampen home buying activity. The combination of weaker demand and projected higher level of inventory, new and resale housing units, will place downward pressure on home price appreciation. Our forecast calls for the median home price in Orange County to increase by 4.0 percent in 2015.
California Healthcare Employment Outlook and the ACA:
- In 2013, about 20 percent of the population, or 7 million people in California, were without health insurance. Current data suggest that about 3.4 million people signed up for insurance during 2014. This includes 1.2 million people who obtained insurance under the individual mandates provision of ACA and about 2.2 million people who are enrolled in the Medi-Cal program.
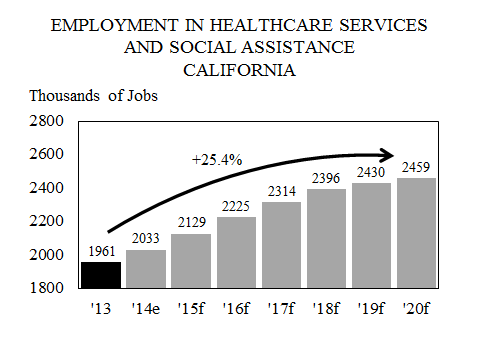
- With gradual increases in the number of insured, our forecast calls for an average annual increase of 3.6 percent in the number of jobs in the healthcare services and social assistance sector over the 2013-2020 period. That translates to an increase of about 498,000 jobs over this period.
- Similarly, albeit at a slower rate, we see an average annual growth rate of 2.1 percent in pharmaceutical & medical devices manufacturing jobs in California over the next six years.
About the Anderson Center for Economic Research
The A. Gary Anderson Center for Economic Research (ACER) was established in 1979 to provide data, facilities and support in order to encourage the faculty and students at Chapman University to engage in economic and business research of high quality, and to disseminate the results of this research to the community.
Annual Schedule of Conferences and Press Releases
JANUARY
- Economic Forecast Conferences for the Inland Empire
- California Purchasing Managers Survey
FEBRUARY
- California Leading Employment Indicator
MARCH
- California Consumer Sentiment Survey
APRIL
- California Purchasing Managers Survey
MAY
- California Leading Employment Indicator
JUNE
- Economic Forecast Update Conference for the U.S., California, and Orange County
- California Consumer Sentiment Survey
JULY
- California Purchasing Managers Survey
AUGUST
- California Leading Employment Indicator
SEPTEMBER
- California Consumer Sentiment Survey
OCTOBER
- California Purchasing Managers Survey
NOVEMBER
- California Leading Employment Indicator
DECEMBER
- California Consumer Sentiment Survey
- Economic Forecast Conference for the U.S., California and Orange County
