Orange, CA—The A. Gary Anderson Center for Economic Research at Chapman University released today its 2018 forecasts for the U.S., California and Orange County. Dr. Jim Doti presented Chapman’s 40th anniversary economic forecast to business and community leaders at Segerstrom Center for the Arts. Following is a summary of Dr. Doti’s presentation. A more detailed analysis and forecasts are included in the enclosed Economic & Business Review.
2018 U.S. FORECAST
Overview
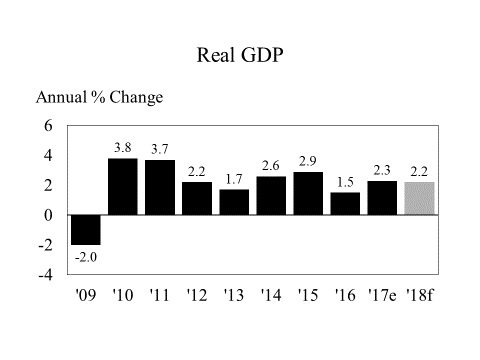
Although cumulative growth during the current expansion has been weak when compared to other recoveries, it is now the second longest expansion on record. The critical question now is whether the expansion can endure in the face of full employment and falling productivity.
Historically, three economic trends have consistently signaled the end of expansions and onset of recession. Those signals include a negative interest rate spread (short-term interest rates are higher than long-term rates), a sharp drop in housing starts and rising levels of private debt. With none of these recessionary signals in sight, we are confident that the expansion will continue through 2018. The rate of real GDP growth, however, is forecasted to decline slightly from 2.3% currently estimated for 2017 to 2.2% in 2018.
Highlights
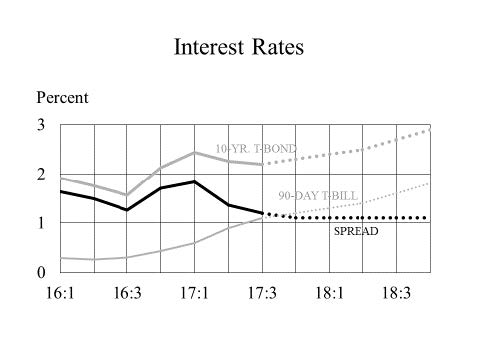
- We believe the Federal Reserve Board will follow through on its earlier intention to raise the fed funds rate before the end of this Then we expect two more increases in 2018. The 90-day treasury bill closely parallels that rate and is forecasted to rise from 1.2% to 1.8% by year-end 2018. The 10-year treasury bond is also forecasted to increase about 60 basis points. With short- and long-term rates increasing in lock step, the interest rate spread is expected to hold steady at 1.1%. Although this is a decline from the 1.8% spread at the beginning of this year, it’s not enough to signal an imminent recession.
- A drop in housing starts is almost always preceded by increases in the supply of unsold units as well as greater pessimism on the part of leaders in the housing industry. Recent trends in these series could hardly be more The supply of unsold inventory at current sales trends is down to four months, while the National Association of Home Builders’ (NAHB) housing market index is near all-time highs.
Although housing production will be constrained somewhat by declining affordability and limited availability of construction workers, our forecast calls for a continuation of relatively strong levels of 1.2 million housing starts in 2018. This roughly matches the cyclical highs reached in 2017.
- Private debt as a percentage of real GDP has held constant near 150% since 2011. In 2018, we see debt While this increase will not be enough to point to recession, coupled with continuing Fed tightening, it is expected to restrain consumer and investment spending.
And while the global economy is probably in its best overall shape since the recovery began, China’s growth will be constrained as a result of its increasing private debt. China’s private debt as a percentage of has increased sharply from 115% in 2008 to an estimated 210% in 2017.
2018 CALIFORNIA FORECAST
Overview
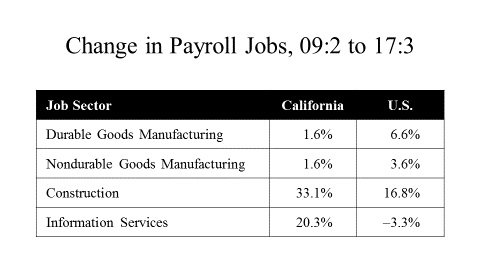
After experiencing sharper job losses and higher unemployment than the U.S. during the Great Recession, California caught up by the end of 2013 and has since outpaced the nation in job growth. But these macro trends mask a number of structural changes in the California economy. In comparison to the U.S., California’s manufacturing sector has hardly grown. The state’s weakness in this sector, however, has been more than offset by very strong relative growth in construction and information services jobs. These sharp swings in the pattern of job creation point to California’s shedding of lower value-added manufacturing jobs to higher value-added jobs in information services. The swings also suggest that California is becoming increasingly dependent on the cyclical and volatile construction sector.
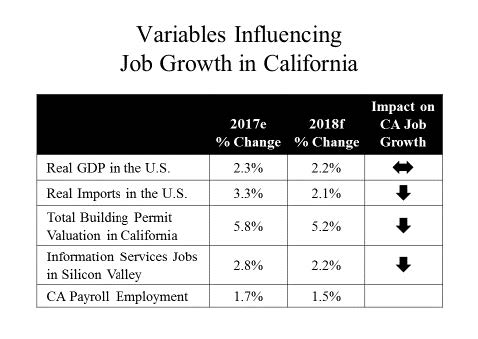 The table at the right summarizes the forecasted impact of the major engines of economic growth in California. The most important variable, real GDP, is forecasted to show little change, while declines in the other variables are mild.
As a result, we are forecasting a slight decline in California employment growth from 1.7% in 2017 to 1.5% in 2018.
Highlights
- California’s manufacturing sector is certain to show additional weakening in 2018. Not only is the manufacturing sector declining nationally as jobs move offshore, but it will be increasingly difficult for California’s manufacturing industry to compete against lower-cost regions in the U.S.
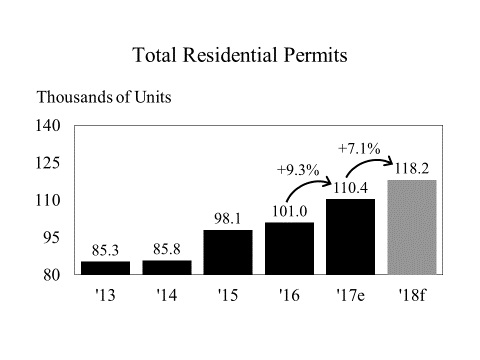
- The supply of unsold resale homes is near historic lows, which suggests a future uptick in construction Given rising mortgage rates, however, housing affordability is forecasted to continue its downward slide. These countervailing indicators lead our forecast to call for solid growth in residential permits in 2018 but at a slower rate than 2017’s pace.
- Proposals to gut NAFTA have the potential to sharply cut into California’s economic This, at a time when the state’s ability to create jobs is already on the wane.
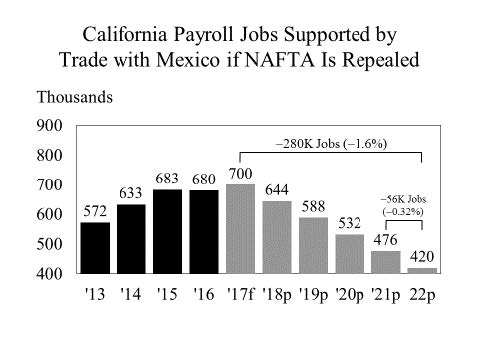 Since NAFTA’s creation in 1995, California’s exports to Mexico increased from $6.5 billion to $25.3 billion in 2016. Imports increased even faster, from $9.0 to $46.3 billion. Moving these imports from Mexico to market creates thousands of jobs in California.
It is estimated that U.S. trade with Mexico will eventually decline by up to 40%, if President Trump succeeds in gutting NAFTA. Our Chapman Model suggests that such a decline over five years will lead to an annual loss of 56,000 jobs in California for a total loss of 280,000 jobs. That represents a job loss of 1.6% over five years.
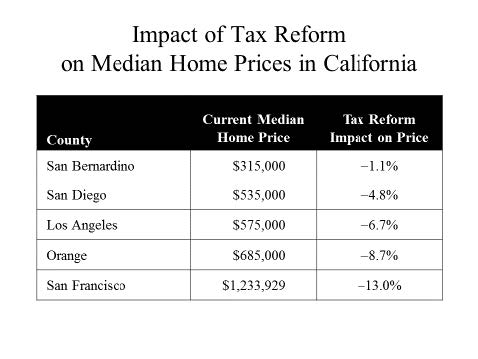
- The Republican-sponsored income tax reform would reduce the tax advantages of owning a home, leading to a decline in the amount a prospective buyer is willing to pay for a A recent study done jointly by Chapman’s Anderson Center for Economic Research and Hoag Center for Real Estate and Finance reported the impact of the proposed reform on the median home price for all California counties. Selected counties are shown in the table at the right. See also Chapman press release, “The Impact of the House Tax Plan on California Counties’ Home Prices,” dated November 21, 2017.
2018 ORANGE COUNTY FORECAST
Overview
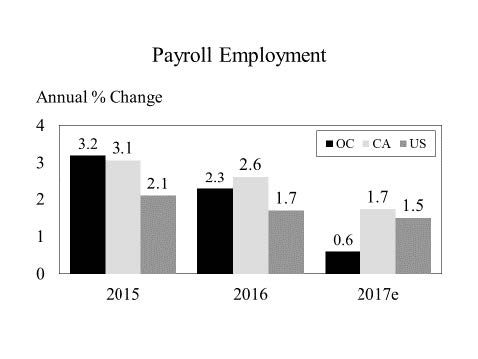
After recovering from a deeper trough during the Great Recession, Orange County mirrored California’s job growth trajectory. In 2015, Orange County’s job growth topped both California and the U.S. The county fell below California in 2016 but still outpaced the U.S. by a considerable margin. Current estimates for 2017, however, suggest that while California and U.S. job growth have continued to slow, Orange County has taken nosedive.
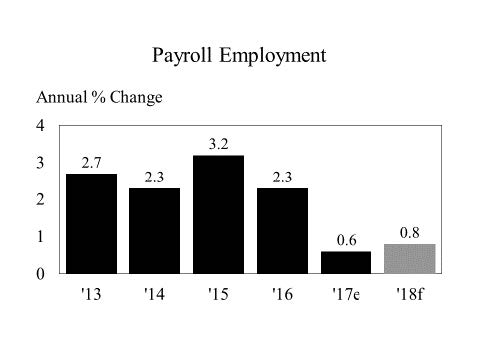 This relatively sharp drop in Orange County’s job growth is broad-based and not a result of any major downward shifts in particular job sectors. The decline in construction job growth from 5.7% in 2016 to 4.8% in 2017 is explained by a drop in residential permits. Manufacturing jobs continued a trend-like decline, but the drop back from -0.4% in 2016 to -1.9% this year was more pronounced. Hardest hit was the services sector. The 3.2% growth in 2016 represented a gain of 24,000 jobs. That compares to 2017’s increase of 1.0% that resulted in only 8,000 additional jobs—a negative swing of 16,000 fewer jobs being created.
Our forecast shows continued weakness but calls for an end to the downward slide with job growth picking up from 0.6% in 2017 to 0.8% in 2018.
Highlights
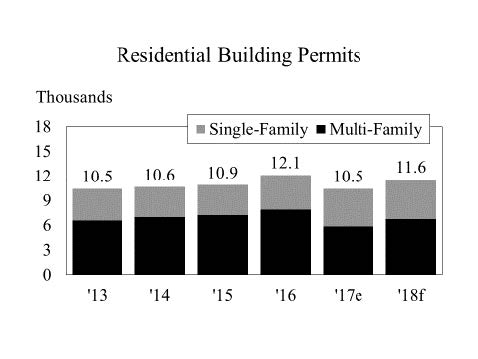
- Although the rate of construction job growth has fallen over the last two years, that sector’s 8% growth made it Orange County’s fastest growing job sector in 2017. In 2018, that growth is forecasted to pick up to 5.3% as permit activity increases almost 11% to nearly 12,000 units. In contrast to 2017, multi-family permits will show more strength than single-family.
- Orange County housing appreciation increased from 3% in 2016 to 6.4% in 2017, but a drop back to 5.2% is forecasted for 2018. Although higher mortgage rates next year will reduce housing affordability, off-setting that is a tight supply of unsold housing that is keeping upward pressure on prices.
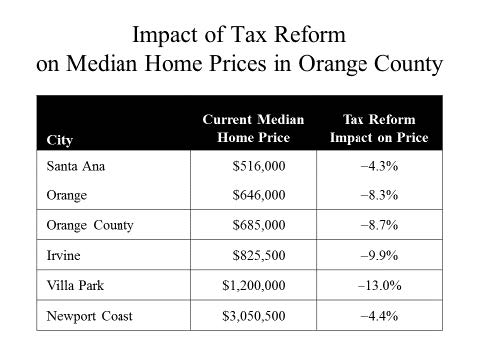
- Similar to the study mentioned in the California Forecast section, the Anderson and Hoag centers have analyzed the potential impact of the proposed tax reform on home prices in all Orange County cities. Selected cities are shown in the table at the See also Chapman press release, “The Impact of the House Tax Plan on Orange County Home Prices,” dated November 17, 2017.
About the Chapman Forecast
Chapman’s inaugural Orange County Forecast, presented in December 1978, was the first economic forecast in the U.S. to be based on an urban econometric model.
The Chapman Econometric Model grew out of a class project. Four decades later, Argyros School faculty and students continue to work together with a focus on providing the most relevant information relating to past, present and future trends in the Orange County economy.
Chapman’s Economic Forecast has grown significantly scope and received national recognition for its statistical accuracy. Between 2004 and 2016, Chapman’s forecast accuracy for real GDP ranked number 1 when compared to forecasts issued by the organizations participating in the Blue Chip Economic Indicators surveys. Chapman also ranked number one in a more comprehensive comparison that includes 2004 through 2016 forecasts for real GDP as well as the unemployment rate, GDP price deflator and housing starts. In addition, the Chapman Forecast Model outperformed the highly regarded Blue Chip Consensus forecast, which represents the average of the survey participants’ forecasts, in both rankings. See the complete rankings on page 3 of the Economic & Business Review.
About the Anderson Center for Economic Research
The A. Gary Anderson Center for Economic Research (ACER) was established in 1978 to provide data, facilities and support to encourage the faculty and students to engage in economic and business research of high quality, and to widely disseminate the results.
ANNUAL SCHEDULE OF CONFERENCES AND PRESS RELEASES
JANUARY
- Economic Forecast Conferences for the Inland Empire
- California Purchasing Managers Survey
MARCH
- California Consumer Sentiment Survey
APRIL
- California Purchasing Managers Survey
JUNE
- California Consumer Sentiment Survey
- Economic Forecast Update Conference for the U.S., California, and Orange County
JULY
- California Purchasing Managers Survey
SEPTEMBER
- California Consumer Sentiment Survey
OCTOBER
- California Purchasing Managers Survey
DECEMBER
- Economic Forecast Conference for the U.S., California and Orange County
- California Consumer Sentiment Survey
