Chapman University recently completed its second annual
Chapman University Survey of American Fears
(2015). Each wave of the survey focuses upon what Americans fear, the potential causes of those fears and the consequences of fear. In addition, the comprehensive survey includes extensive background information about respondents, allowing for examinations of how fears vary by different groups.
The survey asked respondents about 88 fears across a broad range of categories including fears about the government, crime, the environment, the future, technology, aging, sickness and health; natural and man-made disasters, claustrophobia, clowns and many other personal anxieties; and a host of others.
The second annual
Chapman University Survey on American Fears
included more than 1,500 adult participants from across the nation and all walks of life. The 2015 survey data is organized into five basic categories: personal fears, acting out of fear, natural disasters, paranormal fears, and domains of fear.
The latest survey shows that the top 10 things Americans fear the most are:
- Corruption of government officials
- Cyber-terrorism
- Corporate tracking of personal information
- Terrorist attacks
- Government tracking of personal information
- Bio-warfare
- Identity theft
- Economic collapse
- Running out of money in the future
- Credit card fraud

“The 2015 survey data shows us the top fears are heavily based in economic and ‘big brother’ type issues.” said Christopher Bader, Ph.D., who led the team effort. “People often fear what they cannot control,” continued Dr. Bader, “and technology and the future of our economy are two aspects of life that Americans find very unpredictable at the moment.
Acting out of Fear
Acting out of fear was a new element to the 2015 survey. The researchers asked respondents if they had engaged in particular actions because of their fears. What they learned is nearly a fourth of Americans report having voted for a particular candidate due to their fears; and more than 10 percent have purchased a gun due to fear. Other behaviors driven by fear are sending kids to private schools and purchasing a home alarm system.
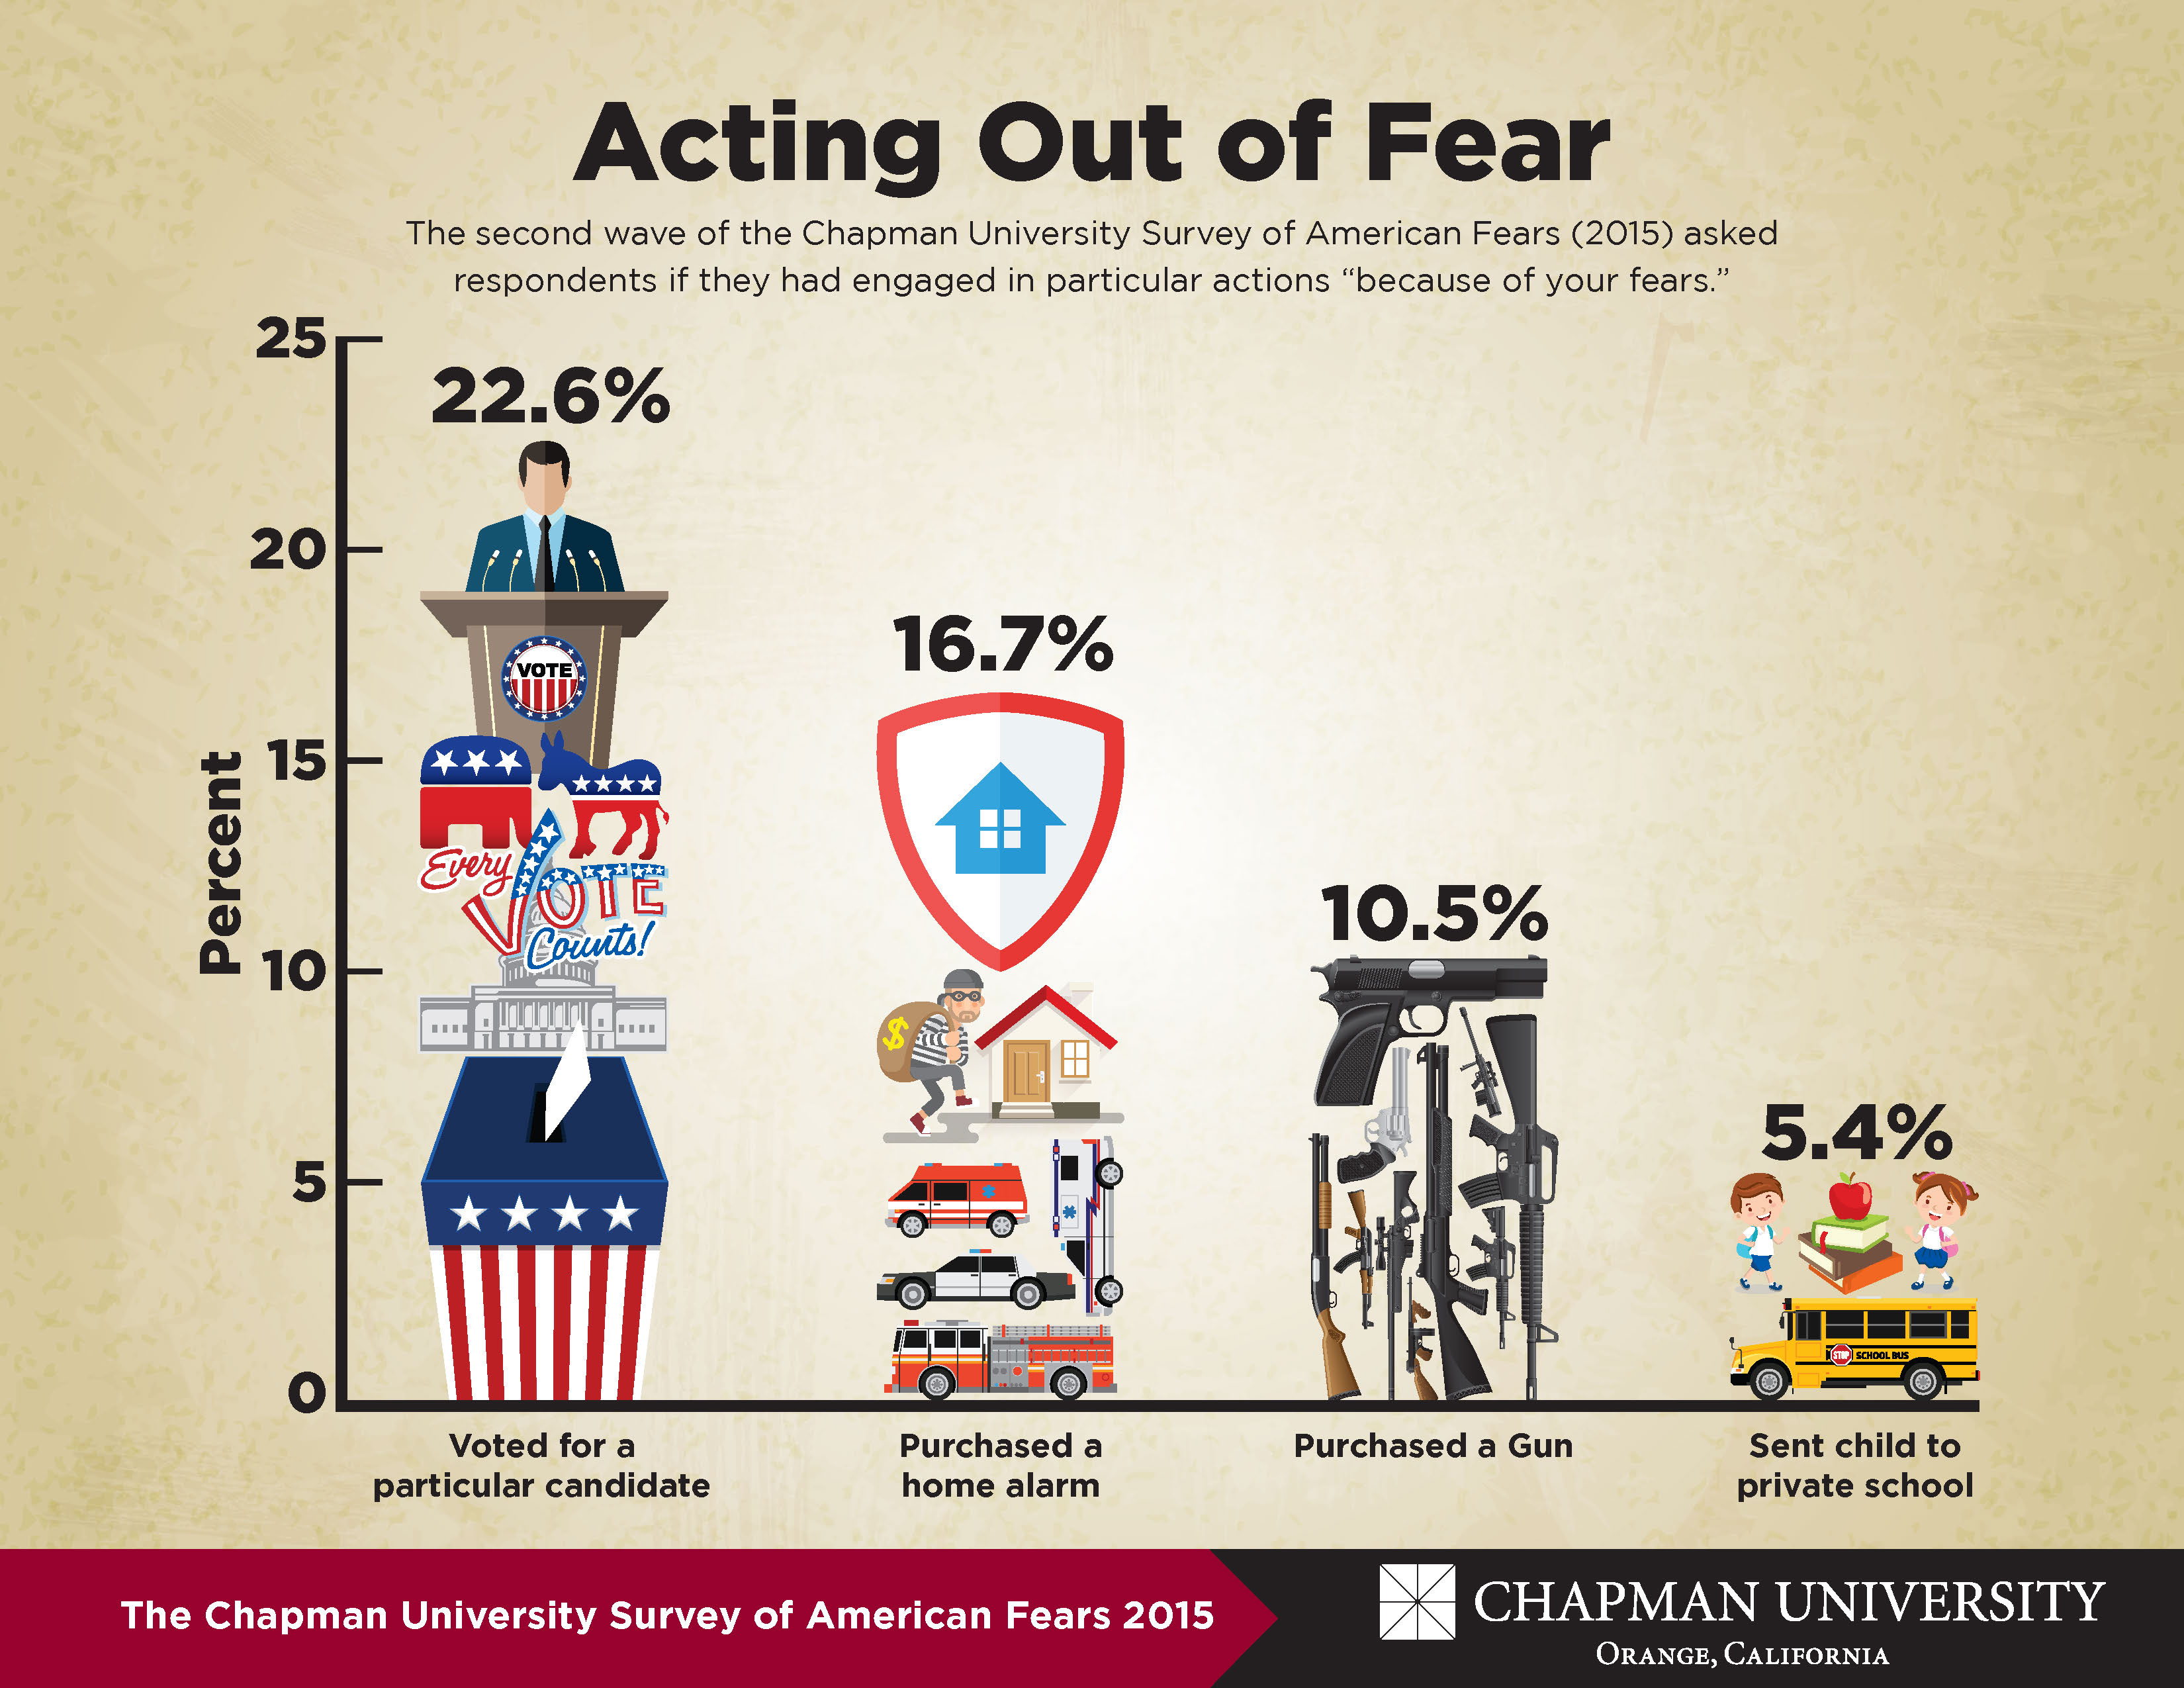
“Fear of the government had the strongest relationship with buying a gun because of fear,” said L. Edward Day, Ph.D., and lead researcher on this portion of the survey. “People who have purchased a gun because of fear also have high levels of fear of technology and crime.”

Americans Need a Disaster Reality Check
More than half of all Americans fear they will experience a natural or manmade disaster. Further, 86 percent believe an emergency kit would improve their chances of surviving a disaster; however 72 percent indicate they have made no effort to put together such a kit.

“We found a major disconnect between people’s expectations of what would happen in a disaster and the reality of a disaster’s aftermath,” said Ann Gordon, Ph.D., and lead researcher on the disaster portion of the survey. “The number one excuse given by Americans for not having an emergency kit is that they expect first responders to come to their aid immediately—this is an unrealistic belief in the wake of a natural disaster.”
The survey showed that the top excuses Americans gave for lack of disaster preparedness are:
- Emergency services will help me
- I just don’t have the time
- I don’t want to think about it
- I don’t know what I am supposed to do
Others reported they could not afford to prepare or purchase an emergency kit.
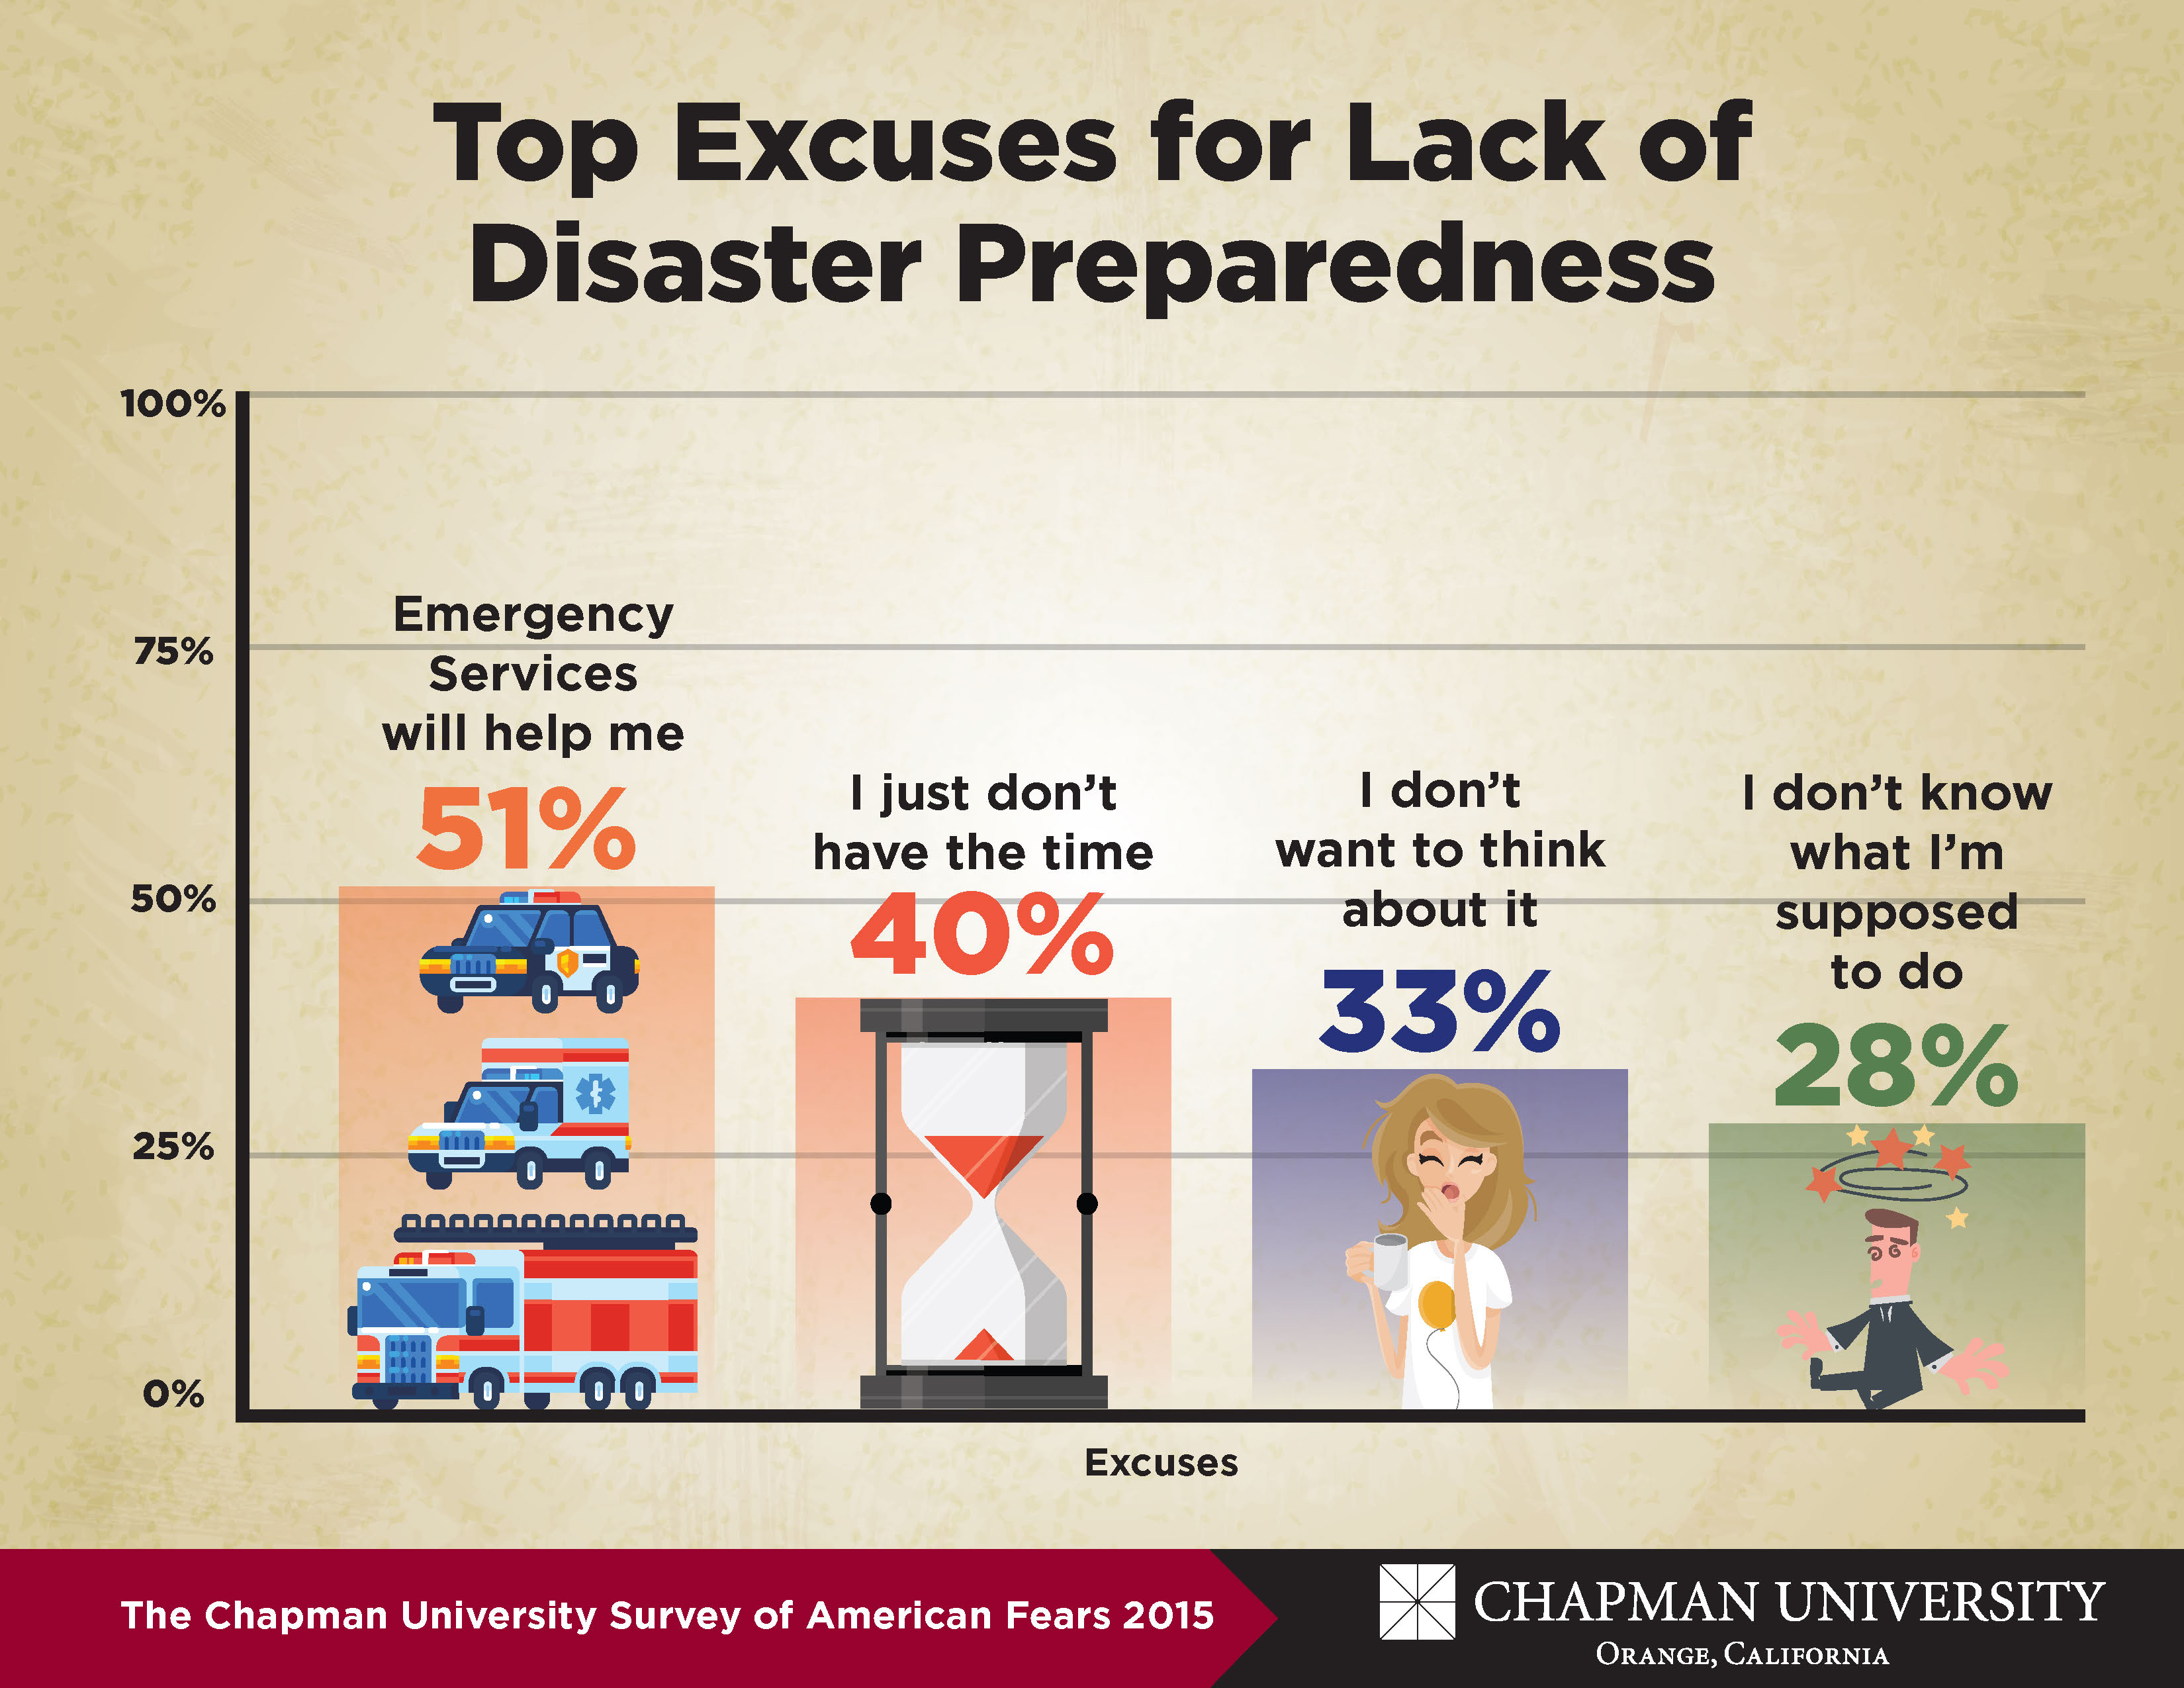
FEMA and Red Cross materials suggest that people have their own food, water, prescription medication and other supplies for at least 72 hours following a disaster, as local officials may not be able to reach everyone immediately.
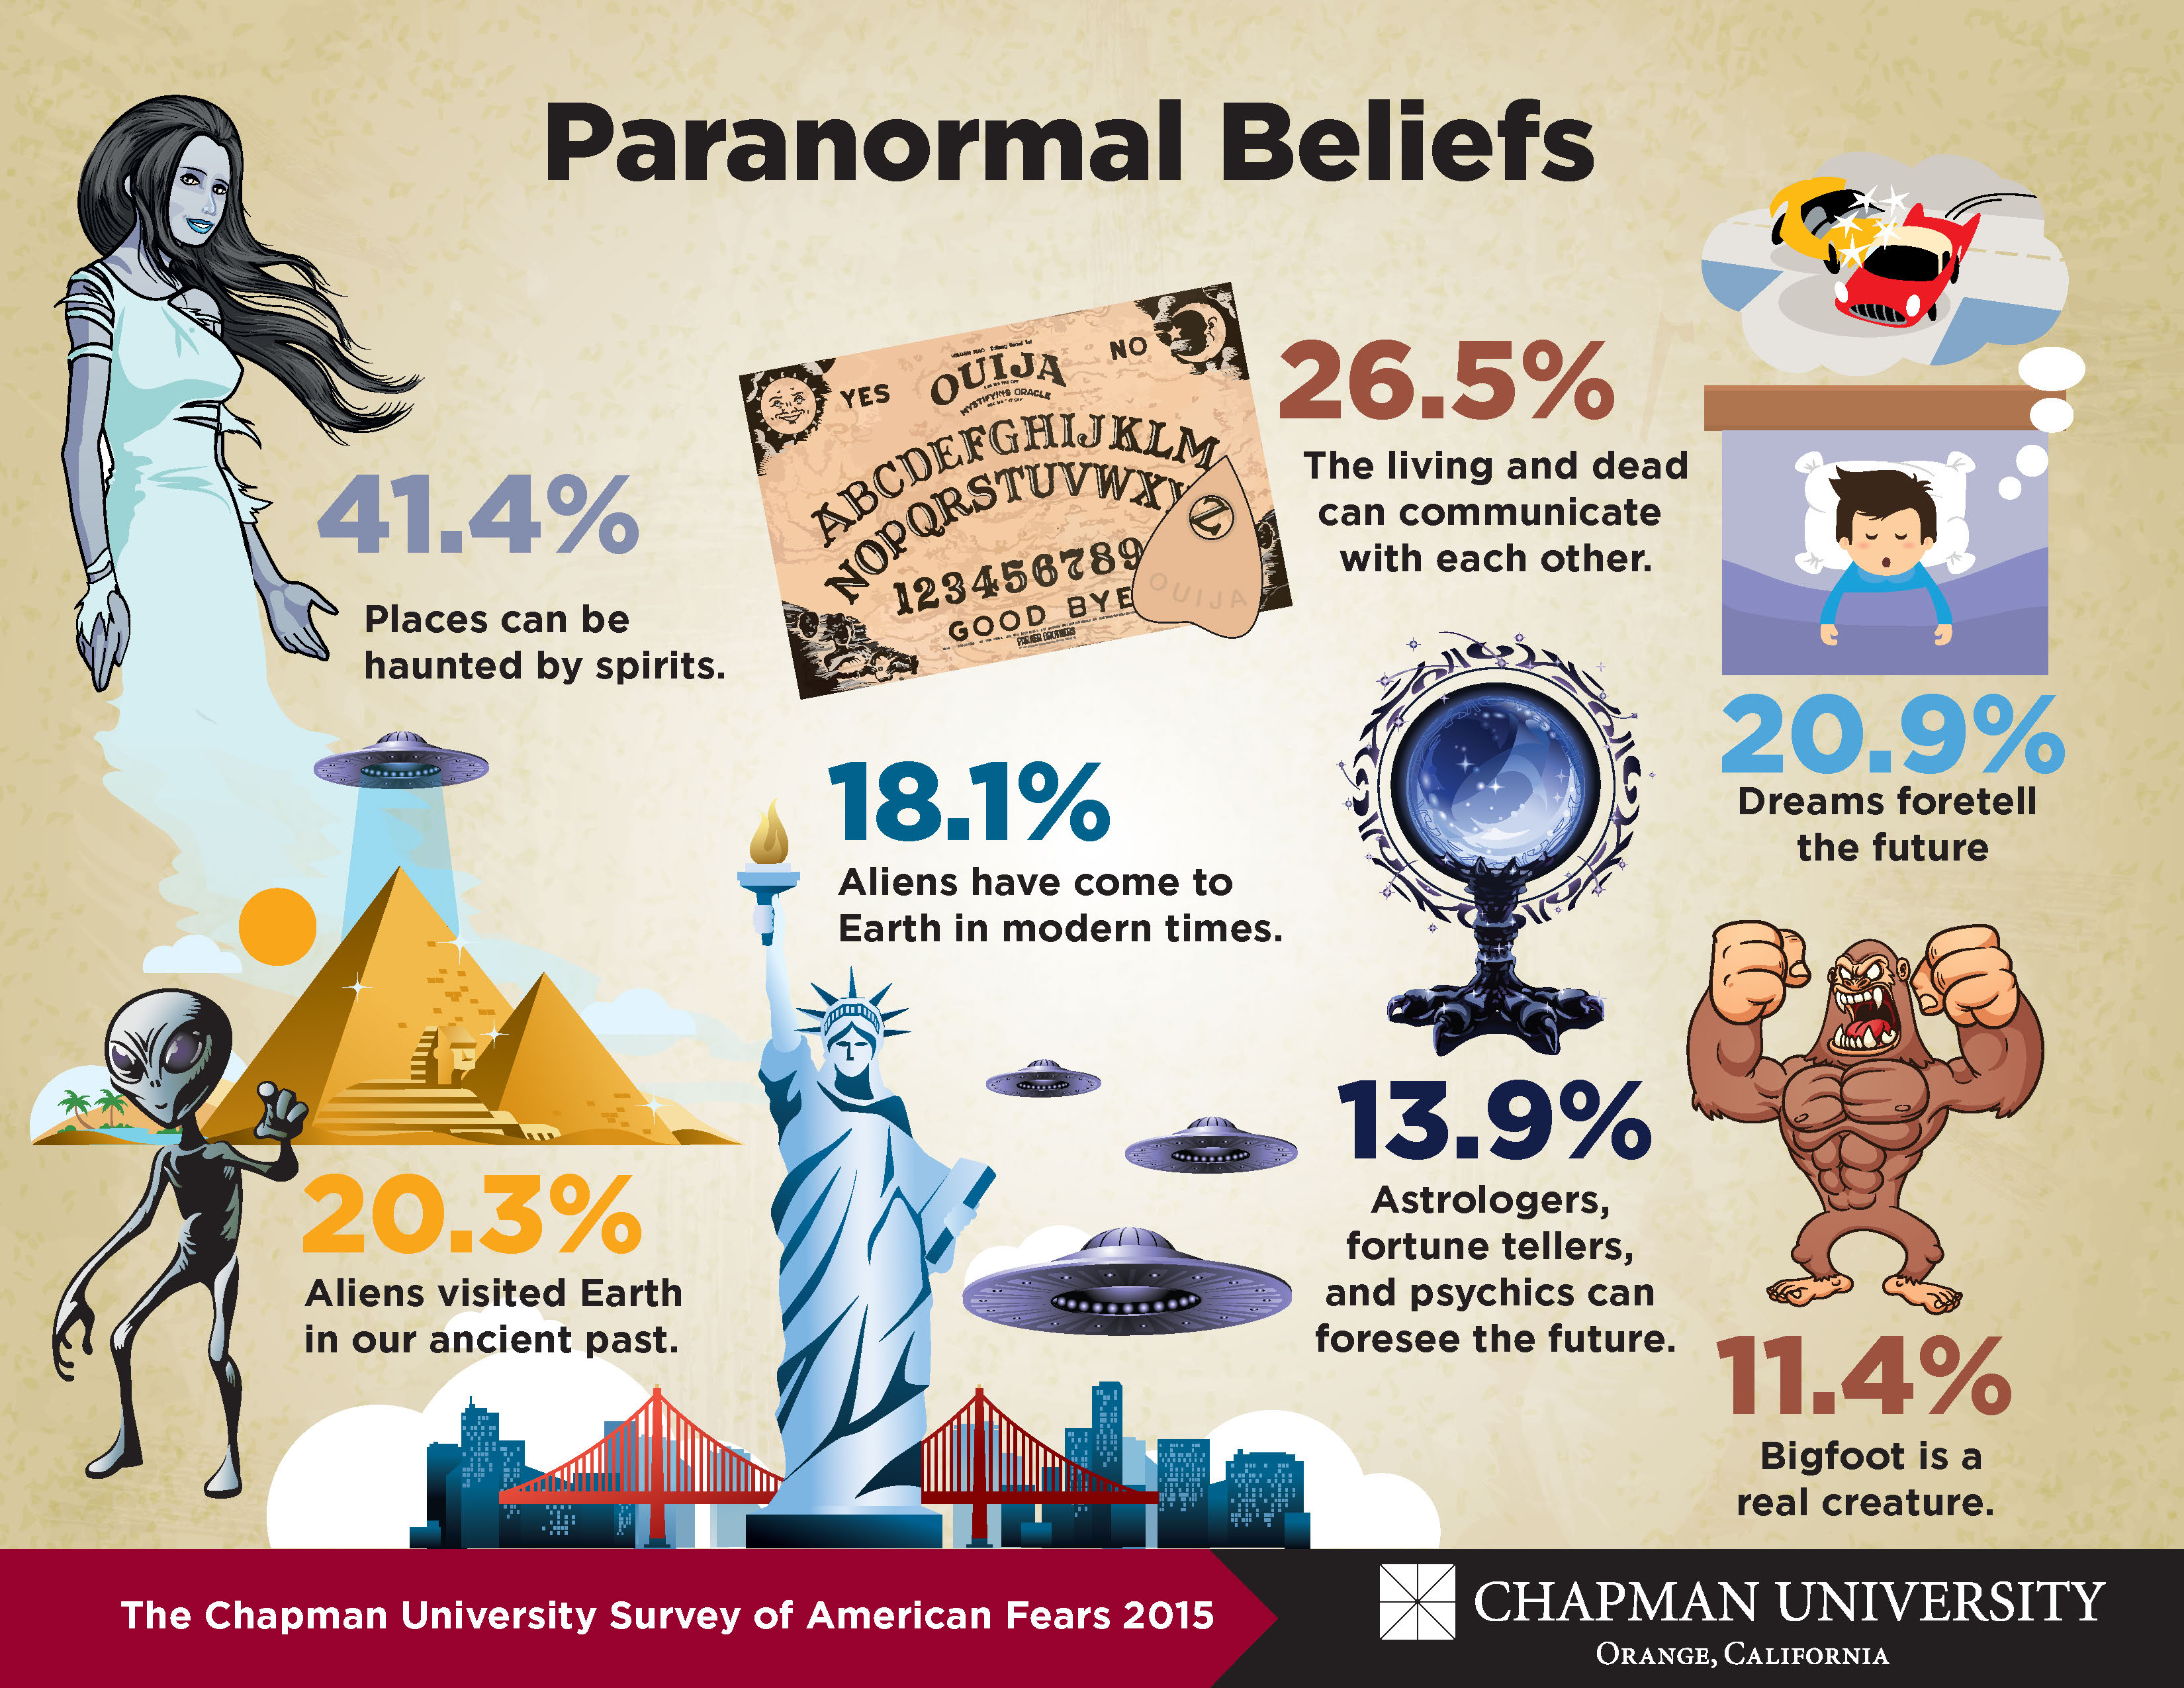
A Haunted World
The Chapman University 2015 Survey of American Fears included items on paranormal beliefs ranging from Bigfoot and psychic powers to haunted houses and the power of dreams. The data shows more than 40 percent of Americans believe that places can be haunted by spirits; and more than a fourth believe that the living and the dead can communicate with each other. Twenty percent of Americans believe both that aliens visited Earth in the ancient past, and that dreams can foretell the future.
“Overall, the survey showed that half of Americans believe in
something
paranormal,” said Dr. Bader. “But that also means half of Americans do not believe in anything paranormal.”
The survey also shed light on certain characteristics of people who believe in the paranormal. People with the highest levels of paranormal beliefs have the following traits:
- Low levels of church attendance
- Non-white
- Catholic
- No college degree
- Female
- Unmarried
- Living in the Northeast.
Domains of Fear
The research team leading this effort pared the information down into 10 major “domains” of fear, which encapsulates the entirety of the 88 individual fears the survey addressed. On average, Americans’ fears lay highest in the domains of man-made disasters, such as terrorist attacks, followed by technology and then the government – such as corruption and Obamacare.
A comprehensive list of the all the fears from
The Chapman Survey on American Fears
can be found
www.chapman.edu/fearsurvey
. In addition to Bader, Day and Gordon, student involvement was key in helping throughout the process.
Methodology
The survey sample was a random sample of 1,541 Americans who are English speaking and over the age of 18. The survey was administered by
GFK (Knowledge Networks)
a consumer research company with expertise in probability samples. Data were collected between May 16, 2015, and May 25, 2015. The survey took, on average, 20 to 25 minutes to complete. The sample of the
Chapman University Survey of American Fears
mirrors the demographic characteristics of the U.S. Census.
The researchers continue to improve the survey as its results and continuing interviews provide more information about fear, as well as how best to collect fear-based information. The second wave of the survey modified question wording such that all questions about fear use the same response categories: “Very afraid,” “Afraid,” “Slightly afraid,” and “Not afraid.” Consequently a comparison of fears between 2014 and 2015 should not be conducted without consultation with the researchers, who can explain the proper method for conducting comparisons across waves.
Consistently ranked among the top universities in the West, Chapman University provides a uniquely personalized and interdisciplinary educational experience to highly qualified students. Our programs encourage innovation, creativity and collaboration, and focus on developing global citizen-leaders who are distinctively prepared to improve their community and their world. Visit
www.chapman.edu
Follow us on Facebook at:
Chapman University Facebook
On Twitter at:
@ChapmanU
On YouTube at:
Chapman University YouTube Channel
###
