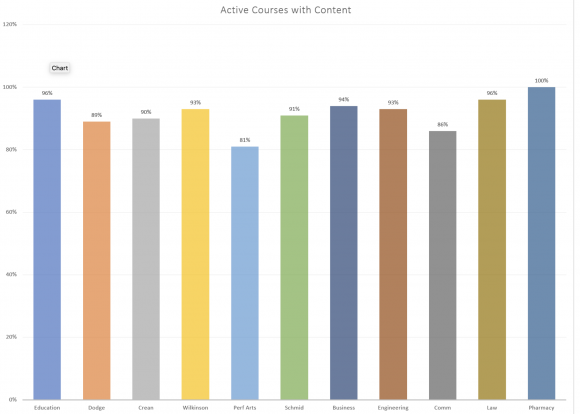
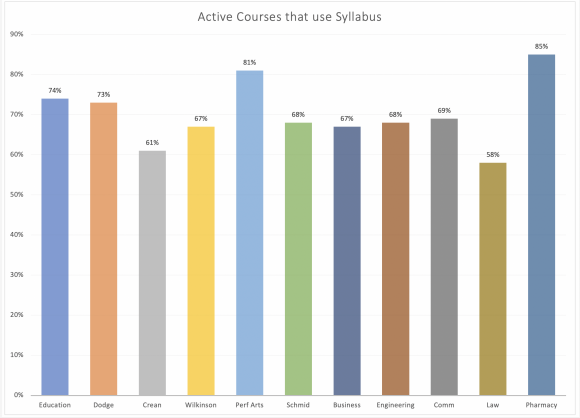
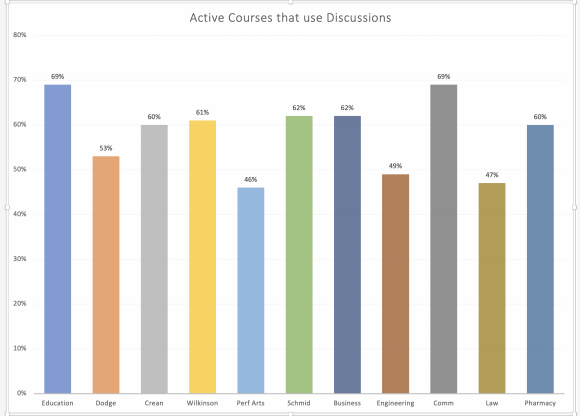
Canvas data from February 2023
March 15, 2023
These graphs represent the activity in active Canvas courses. In this context, “active” courses are courses that have had at least one instructor interaction and four student interactions in the month of February. Click on the image to open it in a larger format:


