Crafting Effective Data Visualizations Learn How to Make Compelling Visuals at Our Upcoming Library Workshop
April 23, 2025
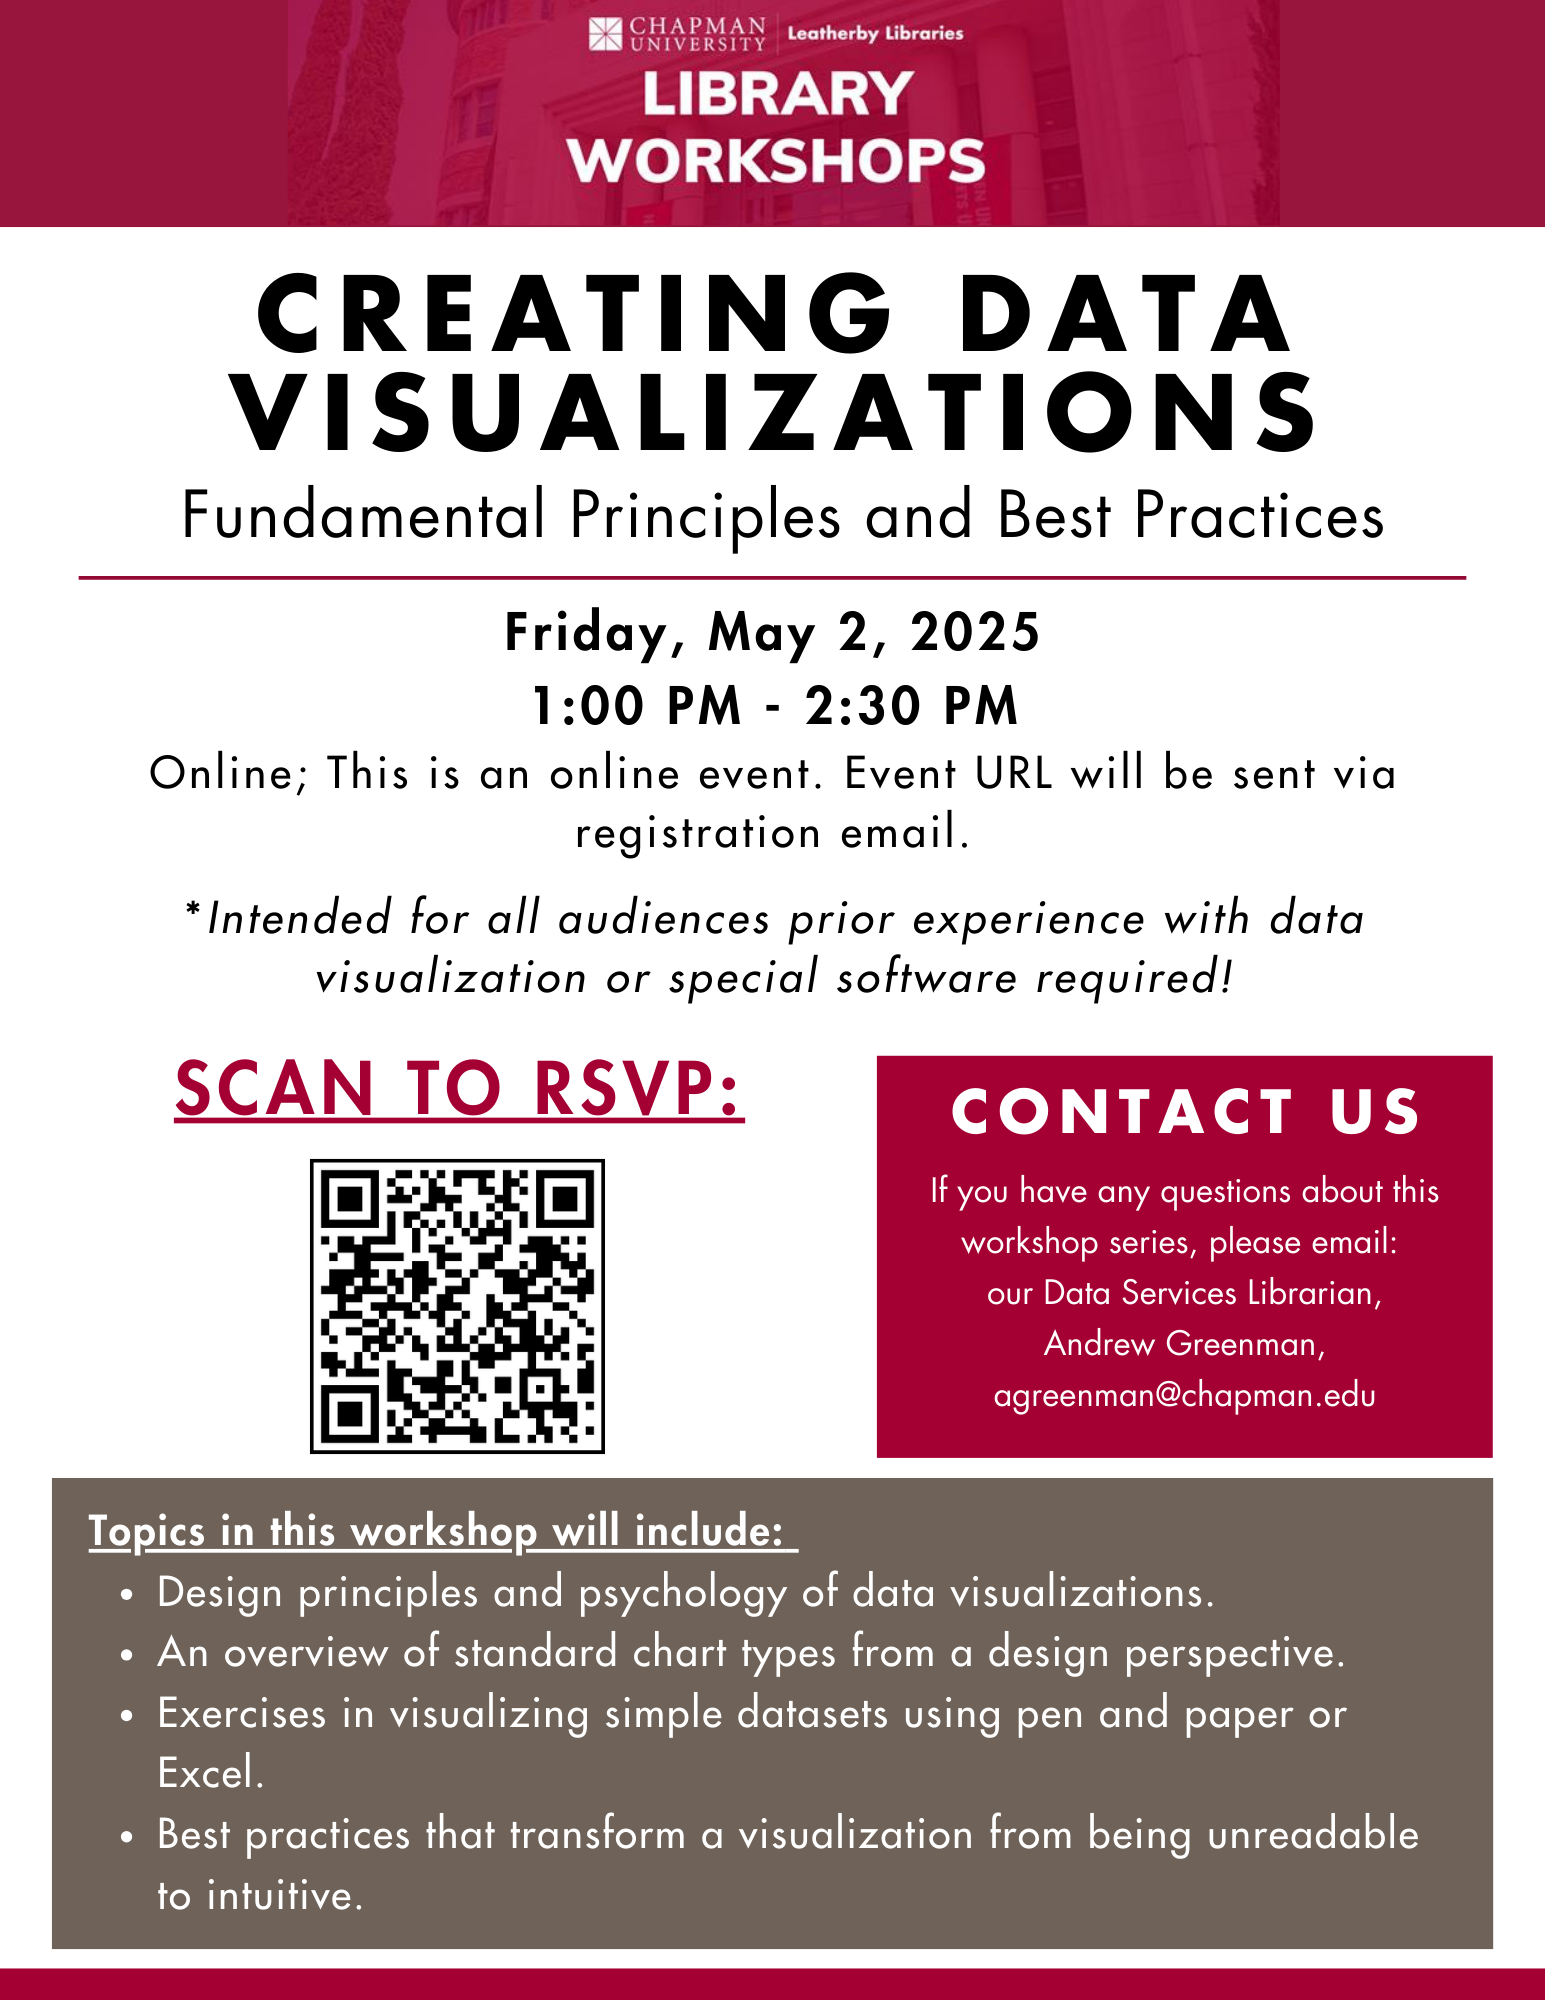
Are you interested in learning more about how to make compelling data visualizations? On Friday, May 2, 2025, we will host a “Creating Data Visualizations” library workshop from 1:00 – 2:30 p.m. hosted by our Data Services Librarian, Andrew Greenman.
This workshop is ideal for Chapman students, staff, and faculty who would like an introduction to fundamental principles and best practices for creating data visualizations. Data visualizations are visual graphics that make data easily understandable. Common examples of data visualizations are bar graphs and pie charts.
Topics will include:
- Design principles and psychology of data visualizations and best practices when creating easy-to-understand graphics.
- An overview of standard chart types from a design perspective.
- Exercises in visualizing simple datasets using pen and paper or Excel.
*This workshop requires no prior experience with data visualization or specialized software. Come prepared to engage and learn in this enriching and exciting workshop!
Register here for this online workshop to receive the event link before the workshop.
For any questions about this workshop, please contact Andrew Greenman at agreenman@chapman.edu.
* During the Academic Year 2024-2025, Leatherby Libraries proudly celebrates 20 years of supporting the academic experience at Chapman University.