3 Ways to Decide What Goes on Your Homepage (using Chapman University as an example)
June 12, 2015
*Listen to my recent “IMA Leader” interview on this topic
Since our new
homepage
launched over a year ago, we’ve seen dramatic movement in the right direction. While crunching the numbers in Google Analytics, Val McNutt, Web Coordinator and resident analytics guru, noticed the following:
- The average time spent on the homepage has gone up 15%
- The bounce rate has decreased by 10%
- Within the first six months following the launch, we saw the average time on the whole site increase by 5%
- Within the first six months following the launch, our site’s overall bounce rate decreased by 4.5%
- In February of 2013, only 1% of the traffic to our undergraduate application information page came from the homepage. Now 11% of the traffic to that page comes from the homepage
Through this data, we can clearly see that our new homepage is an improvement from the previous version. This sentiment is reflected in the positive feedback we have received from Chapman Family members. We also get praise from outside organizations in the form of honorable mentions in blog posts and
awards
.
That said, often I’m asked,
“how do you decide what goes on the homepage?”
Chapman’s web team bases decisions primarily off of data. Data is our absolute favorite tool because it allows us to determine what to do without human emotion, ego, or rank getting in the way, and it produces the best results for our users. Naturally, there are exceptions to our ‘data-driven decision making’ rule, usually driven by politics or institutional aspirations.
Using Chapman University as an example, here are three things you can consider when deciding how to allocate that precious homepage real estate.
1) Data-Driven Decision Making
Data-driven decisions produce the best results for our users, and this methodology is embraced by the internet marketing community in a major way. At the 2014 IMPACT conference presented by the
Internet Marketing Association
, data-driven decision making was one of the primary topics of conversation at the CMO roundtable event, which included marketing directors from Microsoft, Adobe, MGM Grand, and many other major companies.
Data-driven decision making is just that: decisions that are based on unbiased facts and statistics. Using Chapman University as an example, let’s say we are trying to determine what should be listed in the “global navigation” (the black bar across the top of
Chapman’s primary website
). At Chapman, we look at this from multiple vantage points:
- Focus groups and surveys
- Usability testing
- Google Analytics
Below, you’ll see the results of a heat map generated by clicks taken by survey respondents.
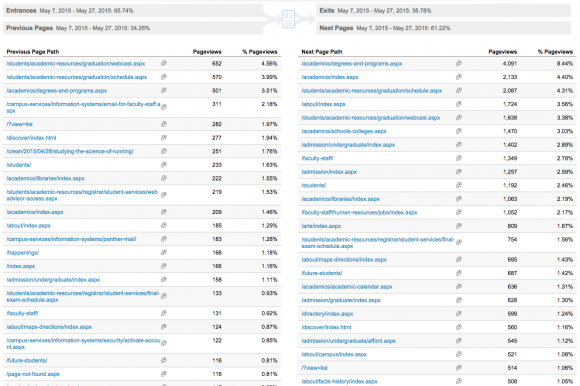
According to the survey data, most users utilizes the Academics link, but few are hitting the Athletics link. When we look from another vantage point (Google Analytics), we see the same pattern.

Academics is probably one of the more popular pages on our site, so let’s dig a little deeper.

The data above reveals that after hitting our homepage, the “Degrees and Programs” page and “Academics” landing page are top ‘next step’ actions.
So what does all of this mean? It means that the Academics link has more than secured its spot in our global navigation. It also means when I’m prioritizing projects, the speed/presentation/overall user experience of those Academic pages will be examined, and if we need to allocate time to improve them, we will.
Unfortunately, this also means that at some logical point in time, I’ll have to have the awkward conversation with Athletics about removing them from the global navigation and better utilize that real estate with something else — something that the data tells us is more meaningful to our users.
The drop-down menu items in the global navigation also came to us after examining the data. According to our Web Design and Technology Manager, Meghan Farrington:
“Navigation on Chapman.edu needs to allow our diverse audience to locate information easily, accommodating all audiences means designing navigation that privileges the information users are most frequently accessing. This is accomplished by providing audience navigation and site navigation to the pages most frequently used as reported via analytics.“

The footer (at the very bottom of all of our www. pages) and the roles based navigation (the drop-down menu in the top left corner) are both influenced by data, in the same way, the global navigation is, but there are just a few exceptions. Any items that are in the global navigation, the roles based navigation, or the website footer that are
not
supported by data are there because of legal requirements, University policy, or politics in general.
How we use data to influence story content on Chapman’s homepage:
Ross Loehner, Web Content Manger, put it best by saying:
“When an organization like Chapman University is blessed with an abundance of interesting people, stories, events and programing, it is imperative that all design and user experience decisions made on the website’s homepage be back by user testing, analytics and marketing strategy. This ensure that we cultivate a desired tone for the University while still acting as a pathway to the multitude of services and information throughout the site. Focus and order is key.“
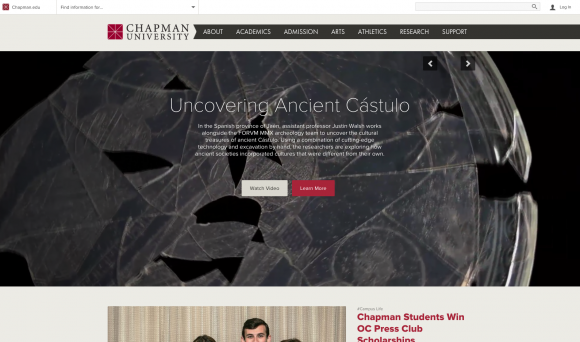
Our homepage showcases beautiful HTML5 video prepared for us by Panther Productions, the video production unit of Chapman’s Strategic Marketing and Communications team. We call this section of the homepage the ‘hero panel.’ According to the mastermind designer of Chapman’s homepage, Meghan Farrington:
“The hero space is designed to be emotive and highly visible, it’s designed to tell stories that connect with our target audiences, and it’s designed to show the world who we are – not just tell.“

The stories featured in this hero panel are selected by a pitch committee. This group of marketers and public relations experts gather to ‘pitch’ stories that they feel communicate the University’s key marketing messages. Some of the content considered at the pitch meetings comes directly from our community VIA
the inside.chapman.edu algorithm
.
Chapman’s robust blog network (
blogs.chapman.edu
) allows anyone with valid Chapman login credentials to submit blog posts for consideration. Stories are then scored by
inside.chapman.edu
’s algorithm and the trending stories percolate to the top of the page. The Chapman web team uses those stories in the official ‘pitch’ meetings. What does all this mean? If you write for blogs.chapman.edu, and if the data tells us that you’ve got an awesome story (via the algorithm) then your story could end up on the homepage. Even if a story does not make it to the hero panel, it could be featured as secondary story elsewhere on the homepage.
2) Aspirational Considerations
If we stick with our global navigation example, you’ll notice that there were a few other ‘low-scoring’ links according to the survey data. Arts, research, and support were also a little warm on the “what are you least likely to use” heat map. You’ll also notice that when users were asked “click on the resource that you have never used, but might be interested in exploring in the future” arts and research do well while support is clicked less often.

Despite the data, support and research are both safe as they are both critical to the University’s aspirations and senior leadership’s strategic plan. This is a great example of something that we’ll elect to keep in the global navigation despite the data suggesting that it’s not heavily utilized there.
3) Politics
This is our least favorite way to make decisions, but as long as we work with humans, there will be a political consideration for what goes on our websites. Why is it our least favorite? Because generally speaking, we may have to include things that the data doesn’t support. Here are some examples of political justification:
- Let’s say one of Chapman’s “schools or colleges” is far more popular than the least popular “school or college.” We’re not likely to favor the most popular school or college just because it generates more hits. That wouldn’t be fair to the other schools and colleges
- In our “roles based” navigation, the current students section is incredibly popular, but other audiences don’t use the website as much. We’re still not going to leave one of our key audiences out, even if the data says that we should
- If University leadership strongly mandates that something needs to be on the website in a particular way, it shall be done
Politics isn’t always about meeting the complex human needs within the organization, but it can also be Washington politics. For example, every University has to provide a financial aid calculator and crime statistics.
So there you have it – these are the top 3 things that dictate how Chapman’s web real estate is allocated. If you have any thoughts, questions, comments or concerns, please feel free to comment below.
