Students Now Have Access to New Analytics in Canvas
February 19, 2025
Dear Chapman Students and Instructors,
We wanted to share the exciting news that students now have access to New Analytics in Canvas.
What is New Analytics?
New Analytics is a tool in Canvas that provides interactive data visualizations to help students and instructors track course grades, activity, and communication.
How can students access New Analytics in Canvas?
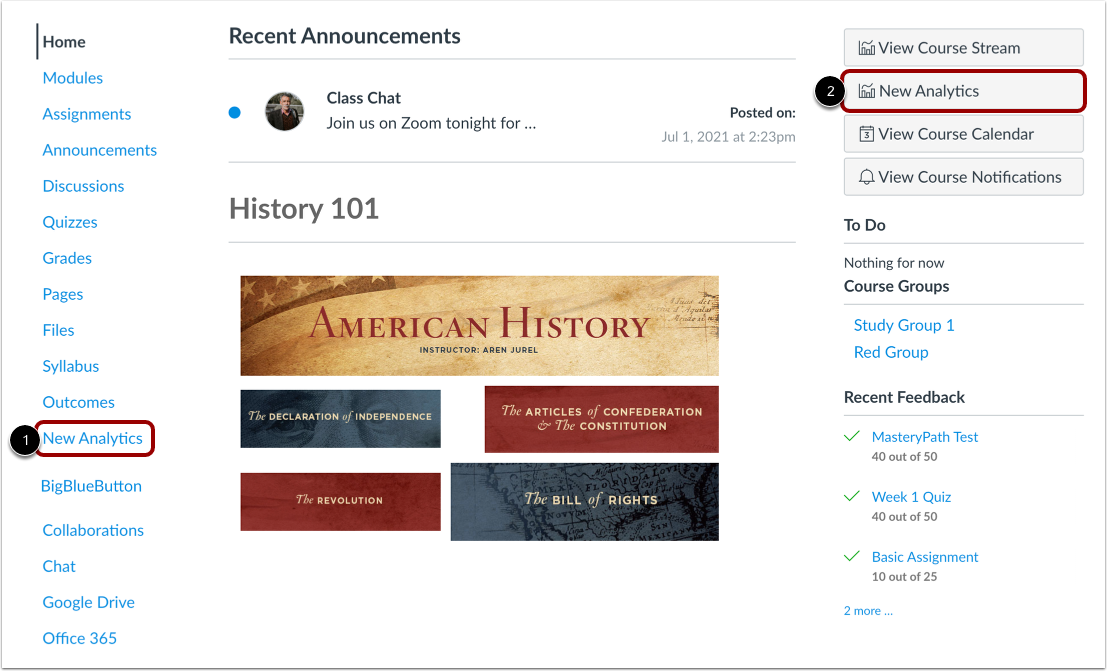
Students can access New Analytics from inside their Canvas courses by clicking on the New Analytics button on the course home page.
If they would like, instructors can also add New Analytics to the course navigation menu by following these instructions. This will give students two different ways to access New Analytics if they are using a web browser and will make New Analytics accessible to students using the Canvas Student mobile app.
What kinds of analytics are available?
In New Analytics, students can access several types of analytics to help them track their progress and engagement in a course.
- Course Grades: Students can view their grades for all assignments, quizzes, and discussions in an interactive chart or table format.
- Weekly Online Activity: This feature shows students their total page views and participation activities, such as posts in discussions or submissions of assignments, on a weekly basis.
- Communication: Students can track their communication with instructors and peers through the Canvas Inbox feature.
For instructors, the New Analytics tool displays data about all students enrolled in the course. Students who access New Analytics can only view their own data.
Resources
For more information about New Analytics in Canvas, please see the following Canvas guides.


