
What You Don’t Know About R Presenting the Intro to R Programming LibGuide
June 21, 2024
Are you tired of repetitive computing tasks and manual data crunching? Processing values with standard statistical data processing software can take hours and often requires utilizing separate software to graph data points. R Programming can save time and effort by running complex statistical analyses while producing engaging data visualizations. The Leatherby Libraries is excited to announce our new Intro to R Programming LibGuide, which provides resources to help students, faculty, and staff start using R.
What is R?
R is a free and open-source programming language supported by the R Project for Statistical Computing. R is a powerful tool for data manipulation, analysis, and graphics. R works on various operating systems (Windows, macOS, Linux, and Unix), which makes it ideal for collaborative work. Additionally, its reproducibility allows others to easily replicate your analysis, increasing your data’s reliability.
Who Uses R?
R can be used across various disciplines, from the social sciences to the humanities to the natural sciences. Here are some examples of R usage in different fields:
- Biology: Run bioinformatics analyses of differential gene expression in RNA-sequencing data for control versus treatment samples.
- Computer Science: Code machine learning models in R to evaluate the proportion of correct predictions for developing artificial intelligence applications.
- Economics: Compile business analytics for sales of electric vehicles in states with and without a rebate program.
- Sociology: Build R packages with custom coding functions to tidy up a large dataset of time series analysis of crime data from the past five decades.
- Psychology: Run statistical reporting and create visualizations of survey data from a questionnaire about life satisfaction for varying age groups.
- Political Science: Determine the correlation of population characteristics with state-level U.S. presidential election outcomes.
Why Should I Learn R Now?
In today’s data-driven world, becoming skilled in R is an increasingly valuable skill across numerous industries. While numerous statistical programs and other programming languages exist for data analyses and visualization, R allows you to run statistical methods in a straightforward, interactive manner. For experienced users, R can provide increased options for calculating advanced statistics with elaborate and customizable graphing capabilities.
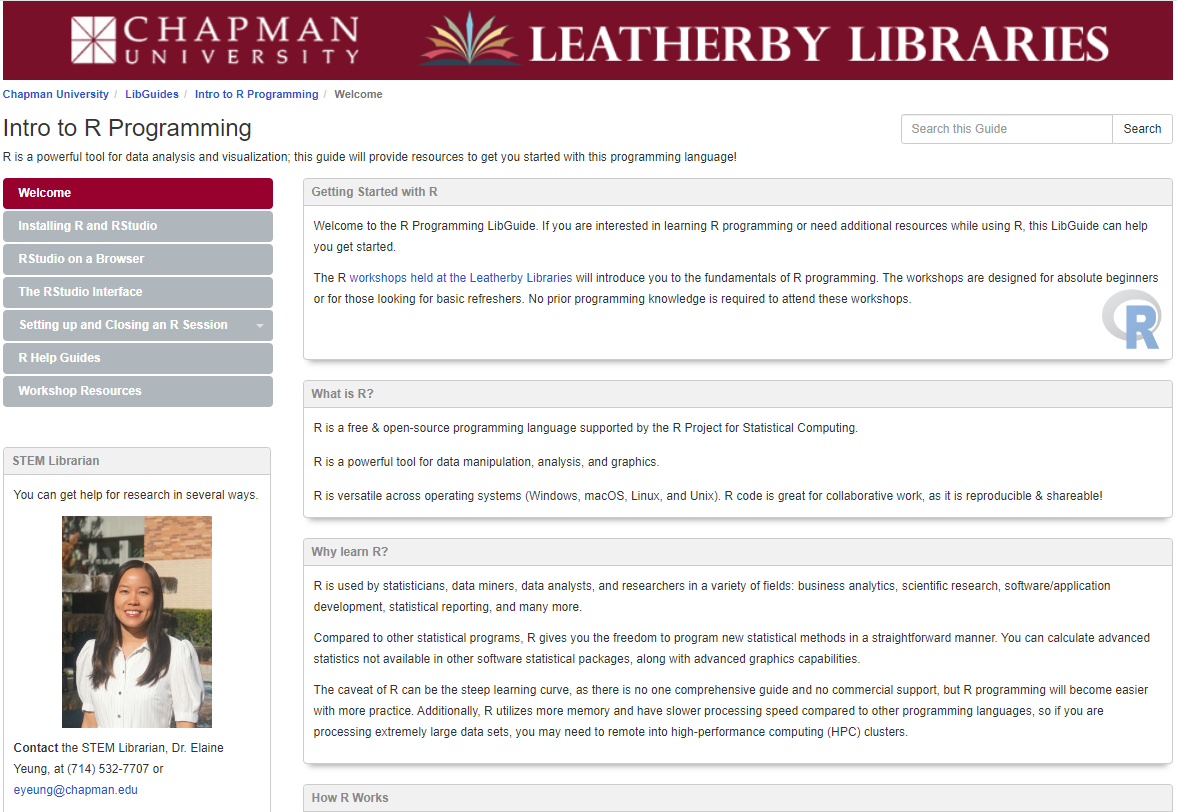
Leatherby Libraries Resources for Learning R
Our STEM Librarian, Dr. Elaine Yeung, has created the “Intro to R Programming LibGuide,” which includes resources on installing and using R, helpful instruction guides, and upcoming workshops to help the Chapman community improve their programming skills. The LibGuide includes resources covering topics like Intro to R Graphs, Intro to Data Wrangling, and Constructing Graphs. It is an excellent starting point for absolute R programming beginners or those looking for basic refreshers.
Keep an eye out for Dr. Yeung’s upcoming Intro to R Programming 3-Part Summer Workshop Series, launching in July 2024, which will provide a crash course on the fundamentals of coding in R.
For more information about starting with R, check out our Intro to R Programming LibGuide or contact our STEM Librarian, Dr. Elaine Yeung, at eyeung@chapman.edu.
*The R Logo © 2016 by the R Project for Statistical Computing is licensed under CC-BY-SA-4.0.