Roughly 1% of the U.S. adult population are Muslims. The political and social scrutiny focused on this small group has led to major political figures advocating discriminatory practices based on religion alone.
In the 2016 Chapman University Survey of American Fears, we explored how Americans as a whole view Muslims. This year, we’ve reexamined many of the same items to see if American opinions had changed. They have.
A Move Away from Support for Institutionalized Discrimination
We included four questions that directly measured opinions regarding Muslims. Two questions focused on whether there should be increased social monitoring of Muslims compared to other groups. These asked whether Muslims should be subjected to increased screening at airports and whether America should cease all immigration from Muslim countries. The other two items focused on general attitudes toward Muslims, the first asking if Muslims are more likely than others to be terrorists and the second asking if respondents would be comfortable with a mosque being built in their neighborhood. Results comparing 2016 responses to 2018 respondents are below:
Attitudes toward Muslims, Entire Sample
| 2016 | 2018 | |
| I think it is okay for Muslims to receive extra screening at the airport | 58.7 | 38.7 |
| America should cease all immigration from Muslim countries | 33.1 | 20.7 |
| Muslims are more likely to engage in terrorist activity than non-Muslims | 43.1 | 33.2 |
| I would be comfortable with a Mosque being built in my neighborhood | 51.2 | 67.1 |
There has been a significant decline in support for increased security measures directed as Muslims. In 2016, a majority of Americans supported increased screening for Muslims at airport and one out of three believed America should cease all immigration from Muslim countries. In 2018, only two out of five agree with extra airport screening and support for an immigration ban has fallen to one out of five.
Although one out of three Americans still believes that Muslims are more likely to commit terrorist acts than non-Muslims, this is down substantially from the more than 40 percent who agreed with this statement in 2016. And two-thirds of Americans now report that they would be comfortable with a mosque in their neighborhood. Just over half of Americans felt that way in 2016.
Correlates of Islamophobia
Although a large proportion of Americans still express distrust for Muslims, this proportion is smaller in every group we examined when compared to 2016. Below, we compare results for urban and rural Americans, males and females, and political party affiliation
Region
In our 2016 data, differences between those who lived in metropolitan areas and those in rural areas were striking. Those differences remain, but fewer people hold negative views in both groups. In fact, in both metro and non-metro areas, those expressing distrust of Muslims are now in the minority.
| Metro 2016 | Metro 2018 | Non-Metro 2016 | Non-Metro 2018 | |
| I think it is okay for Muslims to receive extra screening at the airport | 56.5 | 36.9 | 70.9 | 46.8 |
| America should cease all immigration from Muslim countries | 31.1 | 18.2 | 44.7 | 31.7 |
| Muslims are more likely to engage in terrorist activity than non-Muslims | 41.5 | 31.9 | 52.2 | 39.3 |
| I would be comfortable with a Mosque being built in my neighborhood | 52.5 | 70.6 | 43.8 | 51.8 |
Gender
Both males and females express less distrust of Muslims in 2018 than in 2016. The greatest change, however, has been among men. In 2016, males were more likely to express distrust of Muslims than women. In 2018, opinions are roughly either equal or men express less distrust.
| Male 2016 | Male 2018 | Female 2016 | Female 2018 | |
| I think it is okay for Muslims to receive extra screening at the airport | 61.5 | 38.4 | 55.9 | 39 |
| America should cease all immigration from Muslim countries | 34.9 | 17.1 | 31.7 | 24.1 |
| Muslims are more likely to engage in terrorist activity than non-Muslims | 48.5 | 34 | 38 | 32.7 |
| I would be comfortable with a Mosque being built in my neighborhood | 49.1 | 73.4 | 53.1 | 61.5 |
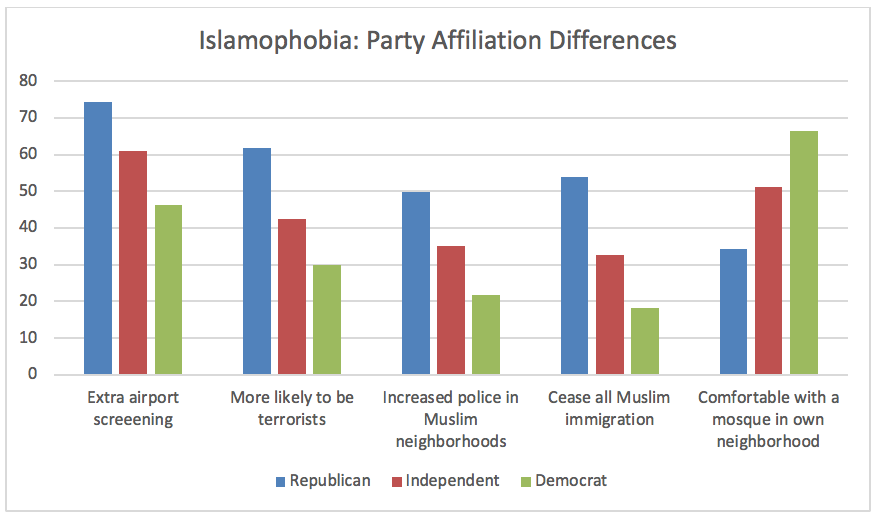
Political Party Affiliation
Republicans, Independents, and Democrats all express less distrust of Muslims now than they did in 2016. There is still a strong relationship between political party affiliation and anti-Muslim views, however. Republicans expressed the highest levels, Democrats the lowest, and independents remain in the middle.
It is worth noting that Republicans are the only group where a majority now expresses distrust of Muslims. Even among Republicans, though, there is no longer majority support for a Muslim immigration ban.
| GOP 2016 | GOP 2018 | Independent 2016 | Independent 2018 | Dem 2016 | Dem 2018 | |
| I think it is okay for Muslims to receive extra screening at the airport | 74.3 | 70.4 | 60.9 | 33.6 | 46.2 | 19.2 |
| America should cease all immigration from Muslim countries | 53.8 | 39.1 | 32.7 | 20.4 | 18.3 | 6.4 |
| Muslims are more likely to engage in terrorist activity than non-Muslims | 61.9 | 62 | 42.6 | 29.4 | 30 | 14.6 |
| I would be comfortable with a Mosque being built in my neighborhood | 34.2 | 40.6 | 51.3 | 69.3 | 66.3 | 85.9 |
Overall, Americans are more accepting of Muslims now than there were in the lead up to the 2016 presidential election. The anti-Muslim rhetoric of some in the president’s administration appears to be generating the opposite effect of what was intended.
Summary
Results from the Chapman University Survey of American Fears show significant portions of the U.S. population distrust Muslims and believe the nation is justified in singling out one religious tradition for increased law enforcement scrutiny. Those with Islamophobic views are more likely to be rural, male, white, older, and lacking a college education.
The survey data do not allow us to dig deeply into the sources of anti-Muslim prejudice. Some of the differences discussed above suggest that unfamiliarity with Muslims is a factor, especially the urban-rural comparison. The differences based on political party affiliation suggest that political rhetoric may be associated anti-Muslim prejudice though these data do not allow us to specifically test the causal order. Regardless of the sources, the prevalence of anti-Muslim sentiment is a concern.
For more information and articles, visit www.chapman.edu/fearsurvey.